Back to Energy Manager Main Menu
Budget Data reports
Budget Data reports display budget data and help you to compare budgets with actual (historical) data.
To access Budget Data reports:
- Click on Reports & Charts from the navigation menu, then select Budget Data.
- Select the Report you want to see.
- Use the fields on the left side of the screen to filter your report information.
- Click Generate Report.
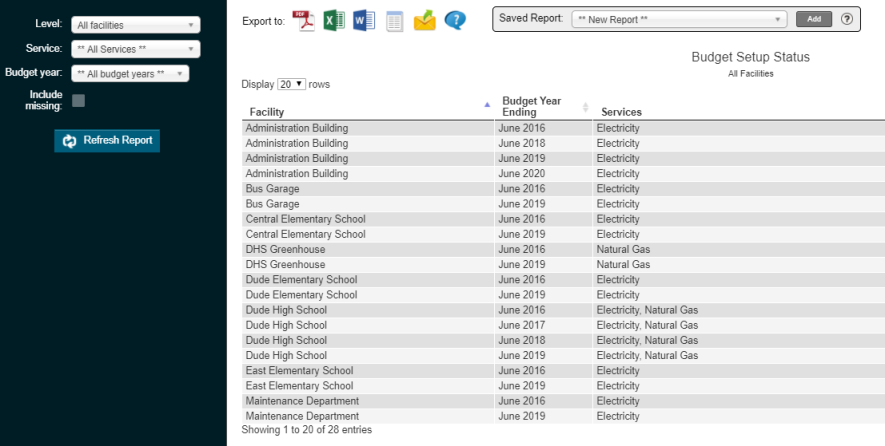
This report helps show whether budgets have been created for all your facilities.
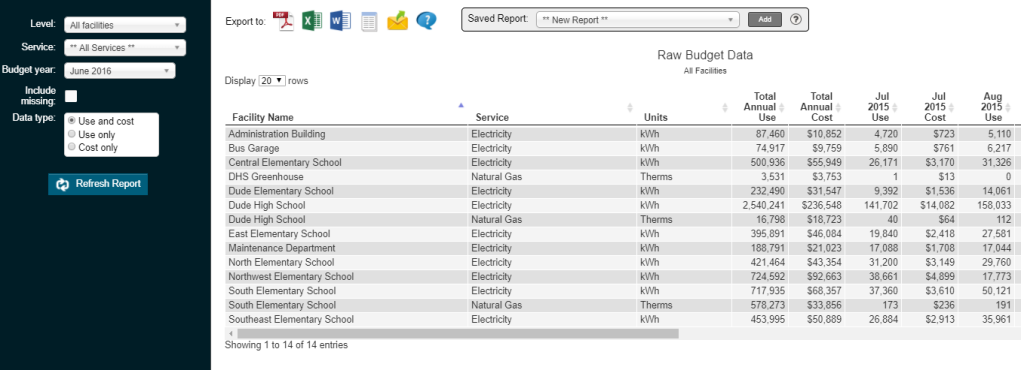
This report allows you to view the budget data for all facilities, including annual use and cost.
This report provides a cost and usage projection by comparing with the actual data from the previous two years. The comparison is on a monthly basis and provides a forecast for the services that are consumed during the budget year.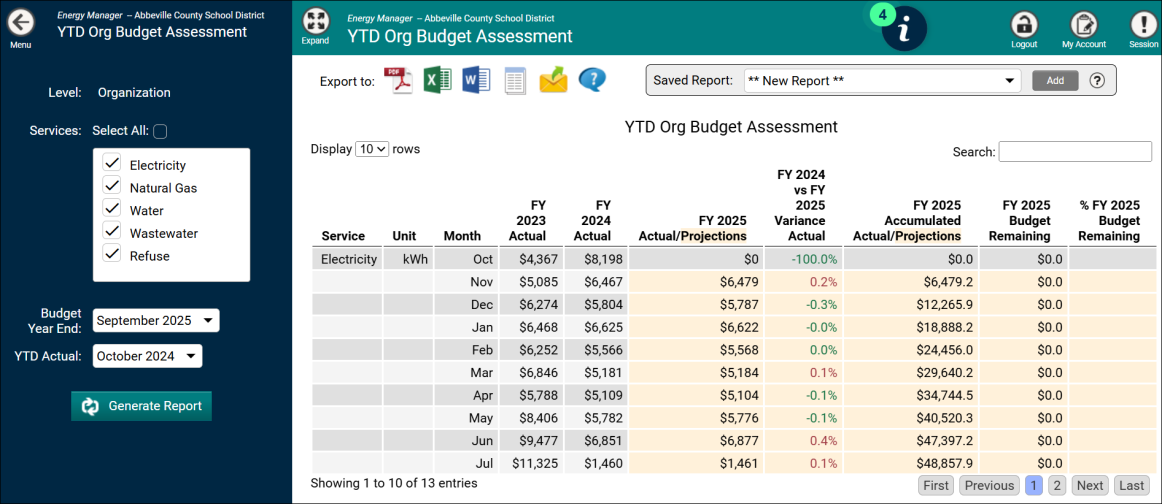
| Name of the Column | Description |
|---|---|
| Services | Name of the service consumed during the budget year |
| Unit | Unit of measurement for the respective service |
| Month | Calendar month |
| FY 2024 Actual | Actual cost incurred for using the service in the year immediately preceding the last year |
| FY 2025 Actual | Actual cost incurred for using the service during the last year |
| FY 2026 Actual/Projections | Actual and projected values for using the respective service the budget year |
| FY 2025 vs FY 2026 Variance Actual | Comparison of the variance (%) between the budget year and last year |
| FY 2026 Accumulated Actual/Projections | Sum of accumulated values (actual and projected) carried forward to the next row |
| % FY 2026 Budget Remaining | Percentage of the amount that is unspent on services during the budget year |
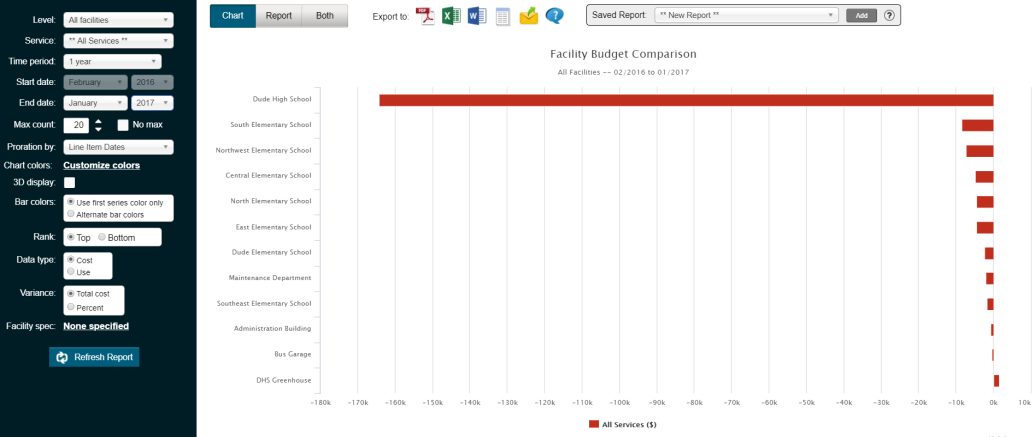
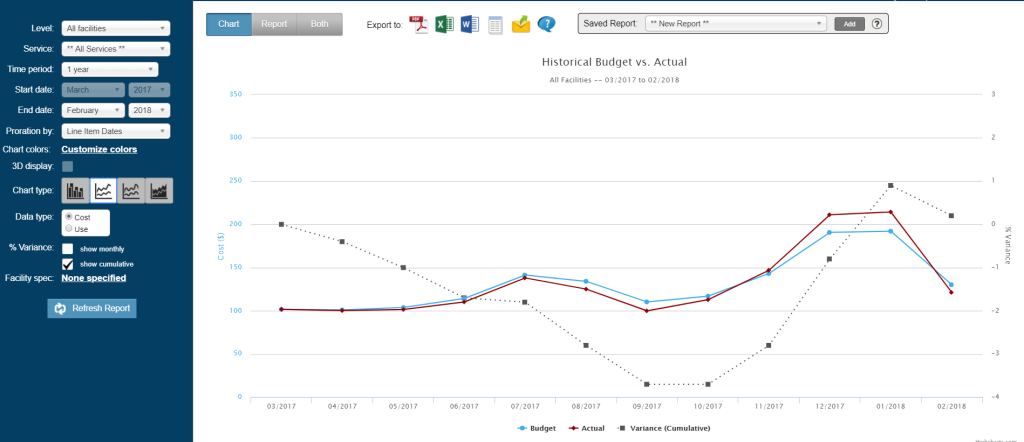
This report allows you to graph actual vs. historical budget data as well as the variance above or below budget.
This report gives a visual breakdown of all your facilities and whether they are over or under budget.